
The following article covers advanced dashboard functionality. By combining Service Watch and CloudReady widgets, you will have full visibility into the environments with Exoprise deployed. There are numbers of ways to build dashboards depending on what you are trying to accomplish.
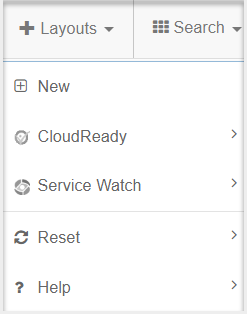
Tabs (formerly Layouts)
By deploying CloudReady Synthetics, Service Watch Desktop, or Browser, default dashboards will be added and can be customized right away. Once you have customized a default dashboard, you can re-create the default by selecting Tabs at the top and selecting the type of pre-built tab you want to re-create. You can also pick new to have a blank dashboard available to build on.
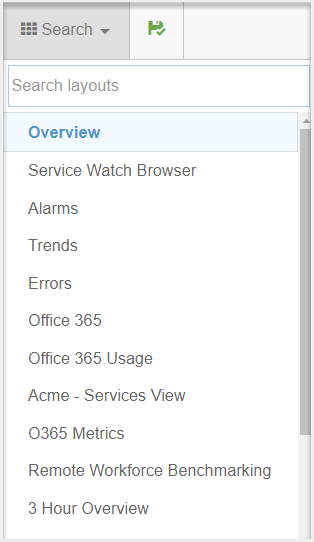
Search
The search option allows you to search through all the personal or shared dashboards you have available in your tenant. Use this to quickly find the dashboard you need at that moment.
Advanced Dashboards Tips
Building Dashboards
When combining CloudReady and Service Watch in Dashboards, it’s important to distinguish the two to avoid confusion, typically you can do this by designating one side for Synthetics and the other for Service Watch.
Knowing your audience
When creating a new dashboard, it is important to consider who the audience is. Dashboards for app owners should contain as much information as necessary for the app, whereas a dashboard for the Help Desk should be tailored toward troubleshooting or trending data for the NOC.
Reset Time Range
To change the time range of all the widgets in a dashboard at once, you can select the gear to the right of the name dashboard tab at the top and select the time range you want from the dropdown.
Weekly Reports
Exoprise offers the choice to send a weekly report of a dashboard to your account’s email address. To enable this feature, follow these steps:
- Click on your username at the top right and choose ‘Profile’ or Click Here.
- In the profile window, select the “Send weekly monitoring status reports” option.
- To determine the dashboard for the weekly report, click on the gear icon beside the dashboard tab’s name.
- Enable the ‘Weekly Report’ checkbox in the menu and click OK to save.