
At the top of the Dashboard areas for either the Personal Dashboard or Shared Dashboard is the Dashboard Toolbar for operations with the dashboards and layouts. See the image for reference:
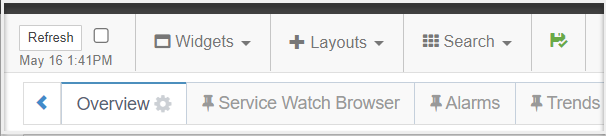
Dashboard Refresh
There are multiple ways to refresh a dashboard layout. Of course you can press F5 from a browser but this refreshes the entire page and is slower.
- To force a refresh of the current tab, click the Refresh button. This update the contents of each widget on a tab
- To have the tab refresh itself automatically, click the checkbox next to the Refresh button. This will update the tab approximately every 2 minutes.
Automatically refreshing a dashboard is perfect for displaying an operational dashboard in a Network Operations Center (NOC) or Helpdesk.
The date and time of the last update is displayed just below the refresh button.
Widgets
The next section of the toolbar is the Widgets dropdown.
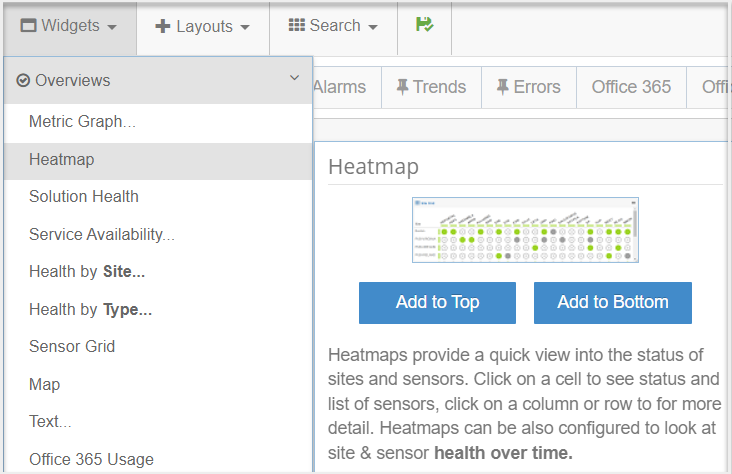
The Widget Dropdown is where you can start to add new widgets to the active layout you are on. As you move your mouse over the different widgets, you can see a preview image of the widget to the right or left. Click any of the widgets to add them to the layout.
Read more about the list of available widgets.
Layouts
The next option on the toolbar is the layouts dropdown.
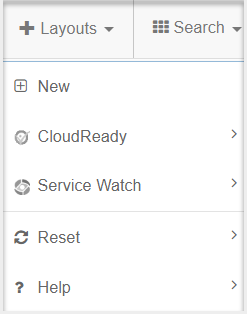
The layouts dropdown allows you to recreate the default dashboards that are created once you deploy a CloudReady Synthetic, Service Watch Desktop, or Service Watch Browser. These include the CloudReady Overview and Availability dashboards for synthetics and Service Watch Desktop, Browser, Device Group Overview, and App Network dashboards.
Search
The Search dropdown is the next option on the toolbar.
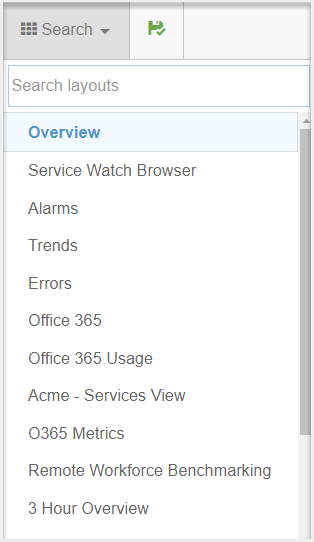
The Search dropdown allows you to search for your dashboards making it easy to quickly pull up the dashboard you need. This option is available in both personal and shared dashboards.
Save & Undo Buttons
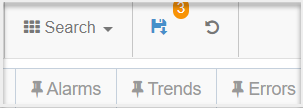
When adjusting and adding widgets to an active layout, the save button at the right end of the dashboard toolbar will accumulate a count of the changes you’ve made to the active layout. To save the layout, click the save button.
There is also a button for undoing the changes and to have the layout revert back to its last saved state. This button appears as soon as you start making changes to the active layout. To undo the changes, click the undo button.