The following information explains how the Network Path Performance information is displayed for Exoprise CloudReady Synthetics and Service Watch.
What is the Network Path Performance?
Each time a Sensor runs or Service Watch collects Streamed Networking data, Exoprise is running a traceroute and calculating the average round trip time and packet loss over five pings. This data is stored in Exoprise, so you have the information you need to identify network slowdowns that may be causing you issues.
Connected and Streamed Networking
When Service Watch is installed and running on a device, it will collect data on Applications running on the machine. The data visible in the Connected and Streamed Networking tab of the device screen will provide you with visibility end-to-end path performance of business critical applications such as Microsoft Teams, Zoom, Webex, and more.
The different networks interacted with are aggregated together and visualized by Network Segment. These provide visibility into the slowest performing networks starting at the device, the LAN, the ISPs, the Backbone Networks, and finally the application specific networks. By selecting Trace Details, you will be presented with the hop-by-hop network performance.
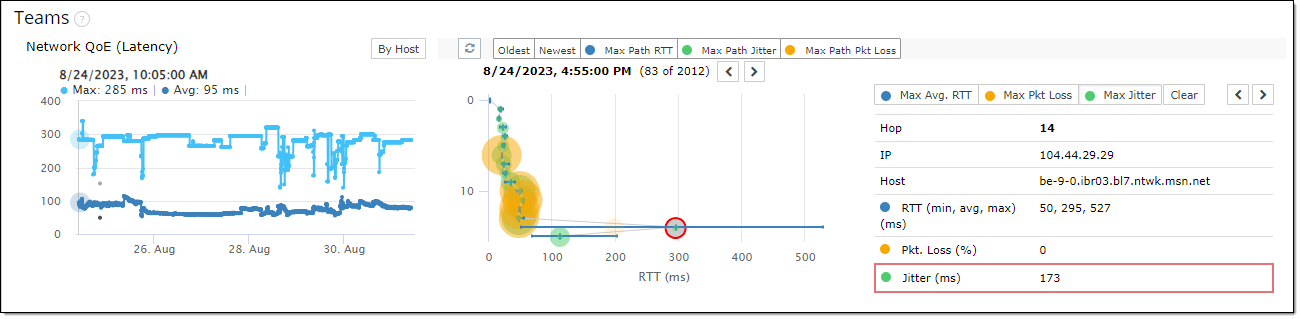
By selecting data points in the Network QoE section, you’ll be able to see the Path Trace section update with the trace route information gathered at that time. You can quickly move from point to point with the left and right arrows. You can also zoom in to the graphs by clicking and dragging your mouse over that data point.
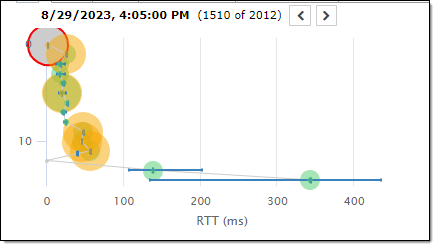
When looking at the path trace, an orange circle shows that there was jitter detected during that hop, the larger the circle the higher the jitter was. The red circles are used to identify when there was packet loss.
Exoprise Synthetics NPP
Each time one of our sensors runs, it will perform a traceroute of that transaction to provide you visibility into where slowdowns or other issues are happening. In the Network Path Performance tab of the sensor, you’ll have the Historical Analysis and Current Segment Analysis, as well as the traceroute that was done.
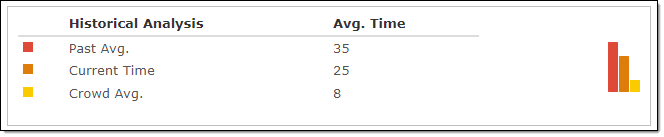
The Historical Analysis will show the average timings of the sensor as a whole, the current transaction, and how the crowd compared.
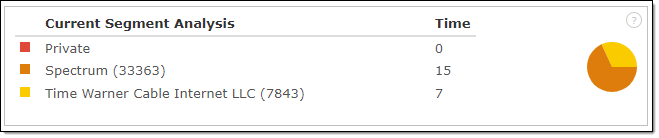
The Current Segment Analysis displays how long was spent in each AS (Autonomous System). The top AS Organizations are listed on the left, with a breakdown of time spent on the right.
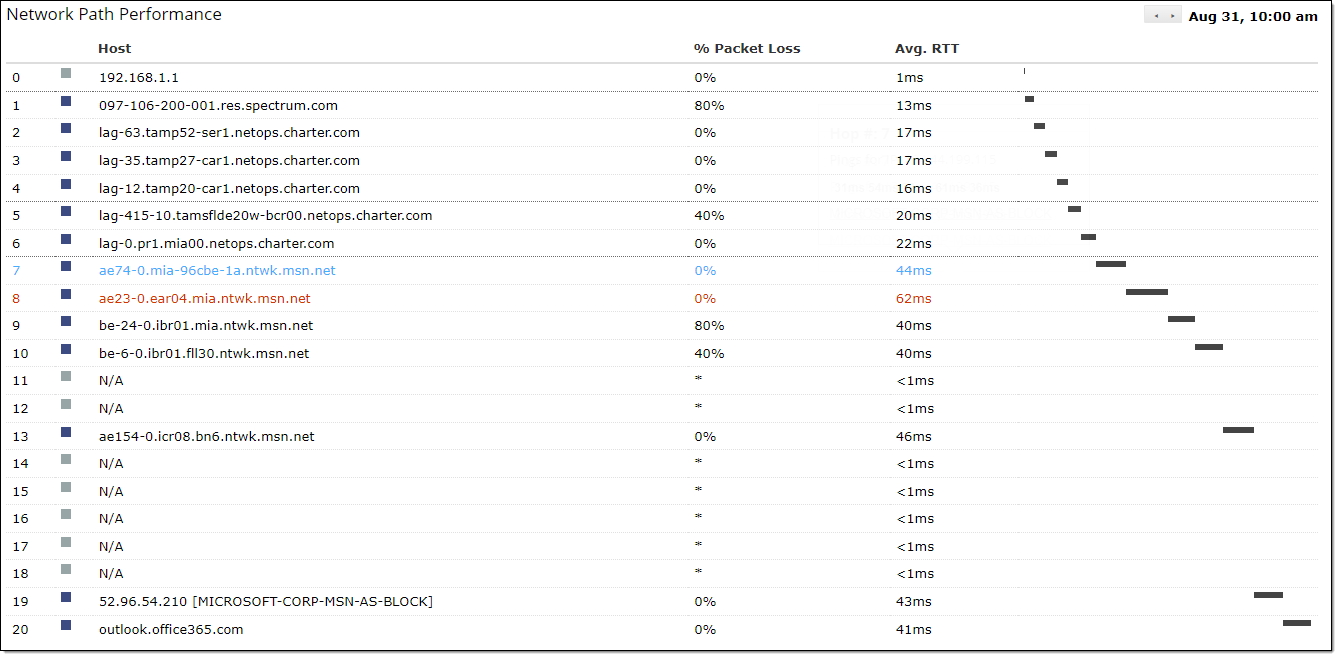
Lastly, the Network Path Performance section will give you the hop-by-hop breakdown of the transaction itself. You’ll be able to see the round trip time and packet loss of each entry, and the longest hop will be highlighted in red. By hovering your mouse over the data points you can get the full AS of that point and by clicking on the host in the popup, Exoprise will look up the host via https://whois.arin.net/