
Service Watch Network Segment Analysis is a newly added feature providing users with a breakdown of the network segments interacted with by an application. Available for both the Connected and Streamed Networking application metrics for Service Watch, this functionality identifies which network segment slowdowns begin to occur. With this information available, engineers can quickly rule out where the issue isn’t, reducing resolution times.
Network Segment Analysis Breakdown
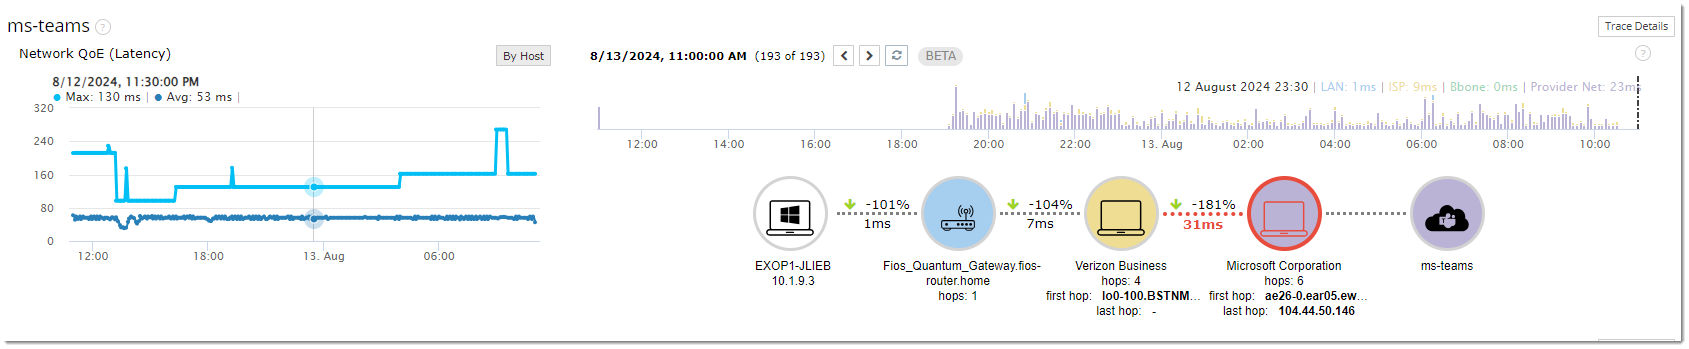
Each entry in the Network Segment Analysis represents the number of hops taken, in a segment, determined by the identified networks in the trace. The line between each segment separates the trends over periods of time. Above the line is the trend for the entire selected time period, whereas the values below the line shows the total time spent in that segment.
Navigating The Network Segment Analysis
There are several options for navigating through the different segments in the Network Segment Analysis. The arrows at the top will allow you to go to the next and previous entries. Selecting a segment from the bar graph above will also update the Network Segment Analysis. There is also an option to zoom in by click and dragging in the bar graph.
Network Segment Analysis Expanded Details
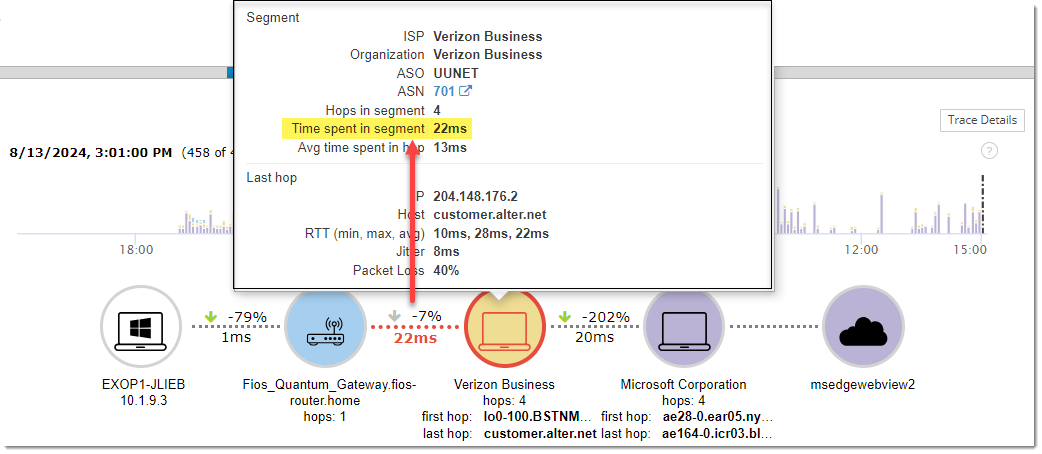
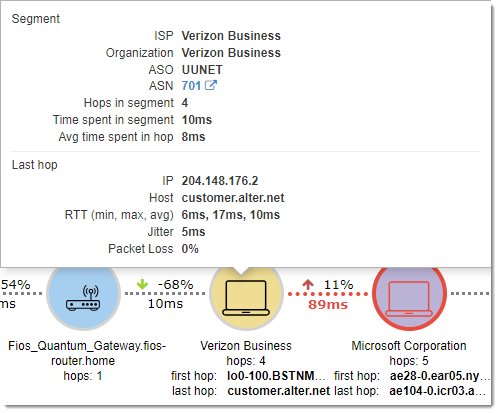
User’s can get more details into the Network Segments by selecting them. In doing so they will be presented with the segment details including ISP, Organization, ASO, and ASN along with the number of hops and time spent in that segment.
The option to view a breakdown of the hop-by-hop details is also available by selecting ‘Trace Details’ above the Network Segment Analysis.
Network Segment Graph
The trace information collected is also available in the Network Segment Graph widget for dashboards.
Click here for more information.