
The following instructions will walk you through deploying Service Watch Desktop providing you with performance metrics of your end users’ machines. You’ll also configure and deploy Service Watch Browser to track how well your day-to-day business websites such as Sharepoint are performing.
Service Watch
- Service Watch consists of two components, Service Watch Desktop and Service Watch Browser.
- Service Watch Desktop is a light agent installed on the machine to gather performance metrics on hardware and software.
- Service Watch Browser is a browser extension for Microsoft Edge or Google Chrome.
- They can be deployed independently or together.
- Service Watch Desktop can enable the browser extension once installed.
Proxy Setup, Requirements, and Firewall Exclusions
Private sites and Service Watch Desktop installations support operating behind all kinds of proxies, proxy configurations, and firewalls. Depending on your proxy configuration there are several recommended ways to set up sites or installations to support proxies.
For private sites or Service Watch desktop installations to work and for setting up sensors, 2-3 DNS names need to be allowed through the proxy, firewall, or any network path blocking that might be in place:
- secure.exoprise.com for Management Client access
- service.exoprise.com for Private Site access
- pubsub.exoprise.com for Private Site alarm logging. This is optional.
Create a Service Watch Browser Configuration.
Service Watch Browser allows you to monitor and benchmark specific websites from the end users Microsoft Edge or Google Chrome browsers. You can add any internal or business-critical domains to track.
- Once logged in, select “Getting Started” if you have not already deployed anything, or “Next Steps” in the top left if you have.
- Under Real User Monitoring, select “Add a Service Watch Extension configuration”.
- On the next screen, select Add Configuration and select Next to be taken to the Domains screen.
- From here, you’ll specify the domains you would like to monitor from the end users’ browsers. You can also select domain sets to add predefined domains for O365, Salesforce, and GSuite. Once complete, select Next in the bottom right.
- In the Users screen, you can Invite Users in the top right, once the configuration is complete, they will receive an email with instructions on manually deploying the Service Watch Browser extension.
- On the Options screen you can opt-in to Enable Trace which requires a Private Site. These Private Sites can also be used to deploy our CloudReady Synthetics, if you are planning on doing so, you can create the site by selecting “deploy one” and following the instructions from this Private Site page.
- You can also set this Service Watch Browser configuration as the default Service Watch Desktop configuration. Once complete, click Next which will take you to the Confirm screen.
- In the Confirm screen, provide the configuration with a Name and Notes and select Finish to complete the Service Watch Browser configuration.
Create a Service Watch Desktop installer.
Service Watch Desktop will allow you to gather in-depth performance information of end users’ machines including CPU, Disk, Memory, WIFI Signal, etc. It will also provide you with call metrics for Teams, Zoom, Skype, and much more. You can also deploy Service Watch Browser along with Service Watch Desktop.
- Once logged in, select “Getting Started” if you have not already deployed anything or “Next Steps” in the top left if you have.
- Under Real User Monitoring, select “Monitor Digital Experience”. Under the Service Watch Desktop section, select Configure an Installation.
- On the Service Watch Desktop screen, select Add Configuration to start the Wizard.
- From the Introduction screen, select Next to get into the Installation screen. Please make note of the installation types, installing as a service will provide you with the most information about the machines. Once selected, click Next.
- OPTIONAL: There may be an optional Proxy Setup page. In the Proxy Setup page, you will want to provide the proxy information for your environment to allow the Service Watch Desktop agent access to reach the Exoprise servers. Once complete, click Next.
- In the Options section, you can opt-in to deploying the Google Chrome and Microsoft Edge extensions for Service Watch Browser using the configuration you built above. Once complete, select Next to get to the Finish screen.
- On the Finish screen you can customize the Landing Page Text if you intend to have the end users download and install Service Watch manually, or you can click Finish to be taken to a list of Service Watch Desktop configurations and select the Download option on the right to generate the EXE installer and deploy through your method of choice.
Service Watch Dashboards
Once you have deployed either Service Watch Desktop or Service Watch Browser (or both) your Dashboards for the two will start populating. To get to this information, in Exoprise, select Dashboards in the top left and then Personal and you will now see them.
Service Watch Desktop
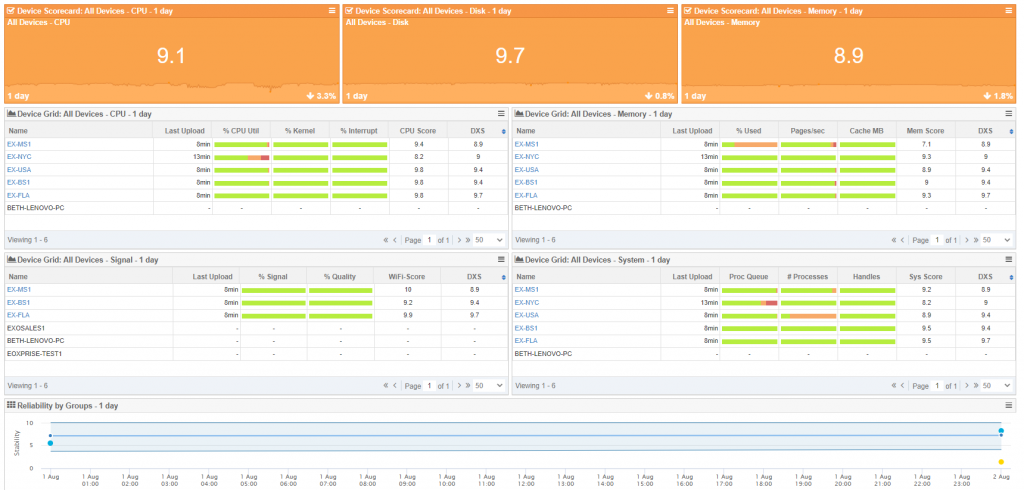
- The scorecards at the top can be used to quickly get an idea of CPU, Disk, and Memory are trending across the machines. The grids below will give you a per-machine breakdown.
- You can click into the machines to get even more information.
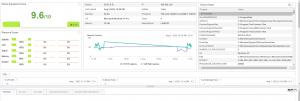
Once you have selected a machine you’ll also have the tabs at the bottom.
- Reliability – Provides you with information on Windows and Application Updates, Blue Screens, and Application Crashes.
- Top Apps – Top ten applications using the most CPU, Disk IO, or Memory.
- Core Apps – Specified applications using most CPU, Disk IO, or Memory.
- Connected Networking – Application response time measured by OS.
- Streamed Networking – Network path performance of streaming applications.
Service Watch Browser
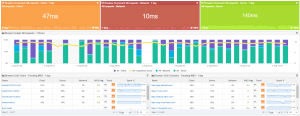
- The scorecards at the top will give you insight into how the performance of the page is trending from the user’s browsers.
- The browser graph helps you see how the pages are performing and can be drilled into for more granular metrics.
- The Grids at the bottom will show you browsers performance for the domains and per domain performance.
- Once you select a domain or user, you can see a breakdown of the traffic itself. You will also have the tabs at the bottom.
- Errors – Errors that are generated from pages users accessed.
- NPP – Network path performance shows hop-by-hop metrics of the transaction.