
The Network Segment Graphs widget provides visibility into the amount of time spent by applications in each network segment. The network segments include LAN, ISP, Backbone, and Provider Network to help pinpoint when and where performance drops occur.
This widget is excellent for comparing the network performance of applications over periods. Utilizing the filters provides the flexibility needed to understand which segments are slowest providing the needed visibility to improve the user experience.
Configuring Network Segment Graph Widget
When configuring this widget, you will be presented with the following configuration screen.
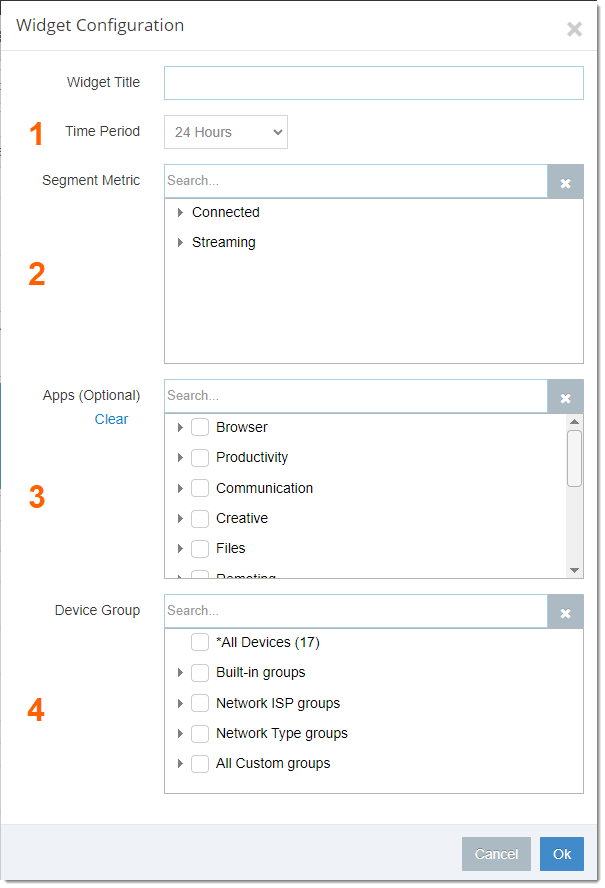
You will need to specify the following fields:
- Time Period:
- Time range the widget should populate data for
- Segment Metric:
- Connected – TCP/IP Round trip times
- Streaming – UDP Round Trip Times
- Apps:
- Select application category or specific application from dropdown
- Device Group:
- Device groups to include in graph
Once the fields have been populated, click OK to generate the graph.
Network Segment Graph Functions
Once the Network Segment Graph widget has been added to your dashboards, there are toggles available to help visualize the information the way you need. The list of toggles include:
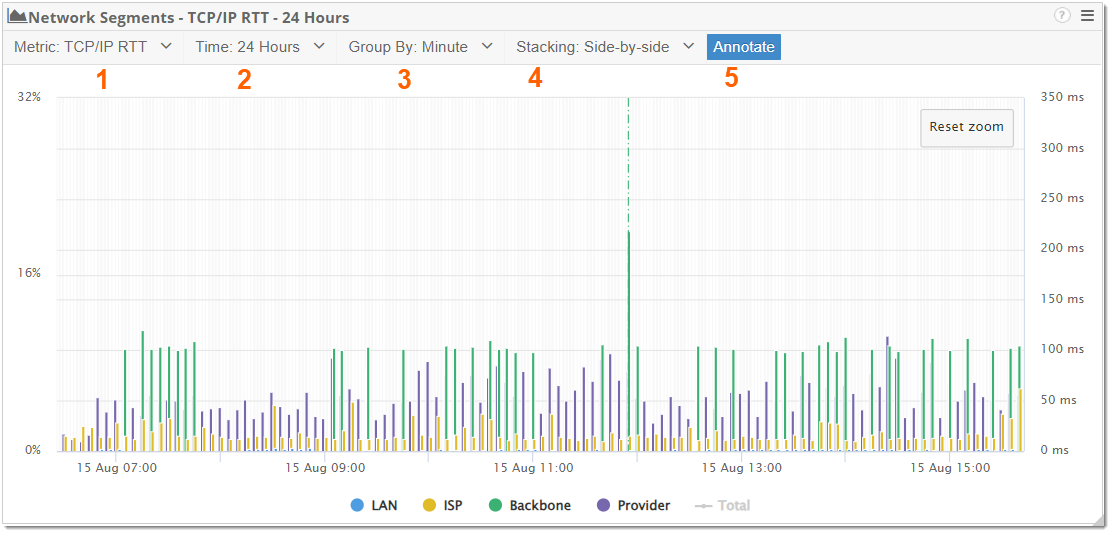
- Metric: Toggle between TCP/IP and UDP metrics
- Time: Time range being presented in the graph
- Group By: Group network segments by time range (Hourly, daily, etc…)
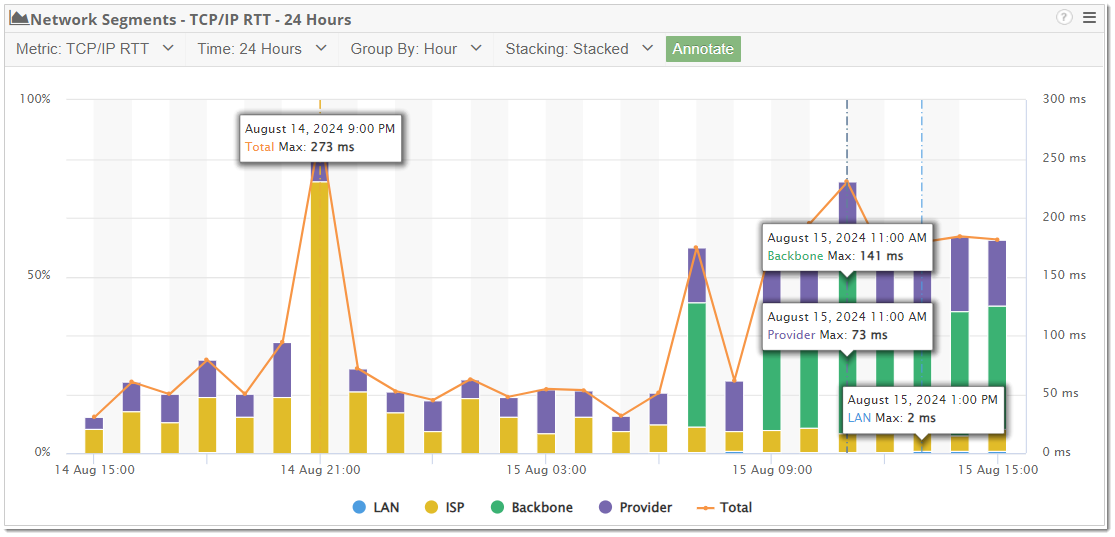
- Stacking:
- Stacked: Stacks the network segments on top of each
- Side-by-side: Side by side network segments
- Normalized: Stacks network segments by timing percentage
- Annotate: Disabled annotations of segments
Drilling Into Network Segments
Selecting one of the network segment entries will present a detailed description for it. The description presented is dependent on the metric selected in the network segment. The available options are LAN, ISP, Backbone, or Provider. The Organization, ASN and number of hops spent in that segment for that time frame are also visible.
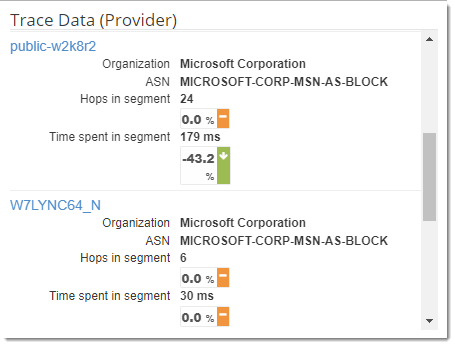
In this description, you’ll also find the devices for the selected Device Groups along with abbreviated Streamed or Connected Networking metrics for the specified application collected by Service Watch. By clicking the device name, you will be brought to the Service Watch page for that device allowing you to drill into more detailed metrics.
Service Watch Network Segment Analysis
The Network Segment Analysis information is available in the Streamed and Connected Networking sections of Service Watch. The information presented here is for the specific machine and can be navigated by selecting entries in the graph or using the forward and previous arrows.
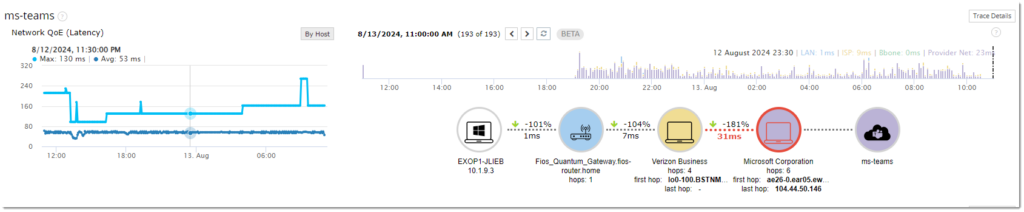
For more information on the Network Segment Analysis click Here