
Exoprise released new features and upgrades for the 1st half of 2024, some updates are still ongoing
Service Watch Active Test
Exoprise launched Service Watch Active Test, a combination of lightweight synthetics alongside the real-user monitoring delivered by Service Watch Desktop. Combining synthetic tests from user endpoints, enables IT teams to diagnose difficult to solve network problems.
Active Test was a frequently requested feature enabling early detection of network problems that users experience when working remotely, on the road, or in a branch office. Use cases for lightweight synthetics from the user’s desktop include:
- Testing VPN performance and uptime
- Proactive testing VoIP and end-to-end network performance
- Testing access to on-premises hosted resources for branch off and remote users
Along with excellent network baselines generated by Active Test, alarms can be configured to proactively raise tickets or alert networking staff and decrease root-cause analysis for everyone.
Service Watch Active Test can be configured within the product and then enabled in a configuration or for each installation.
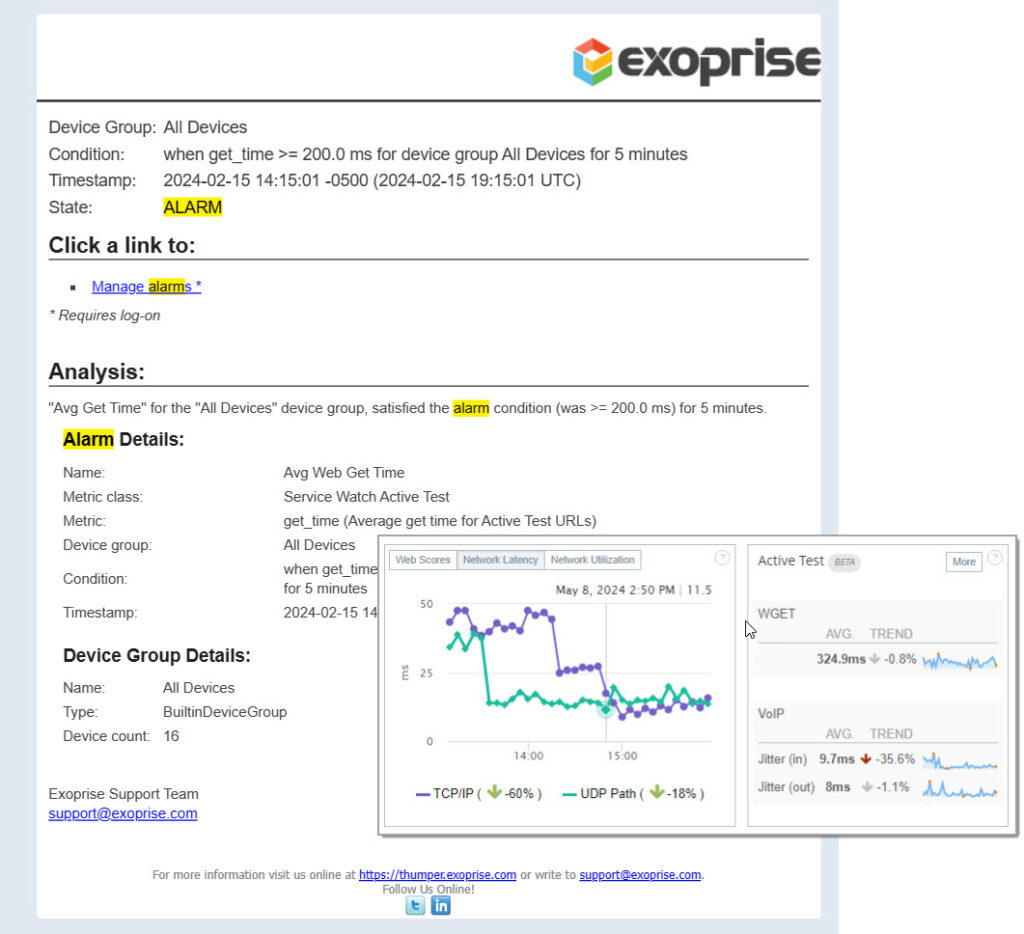
Service Watch Alarm Analytics
For Service Watch Desktop Alarms, the emailer now supports clicking through to an analysis for the condition across Device Groups.
Improved Licensing of Service Watch for macOS
Previously, Service Watch Active Test wasn’t included in macOS, but now it is. A single credit gets you 6 seats of Service Watch Desktop for macOS, which now includes Service Watch Active Test lightweight synthetic monitoring. Service Watch Desktop for macOS is the only solution for real-time network telemetry and path diagnostics for macOS.
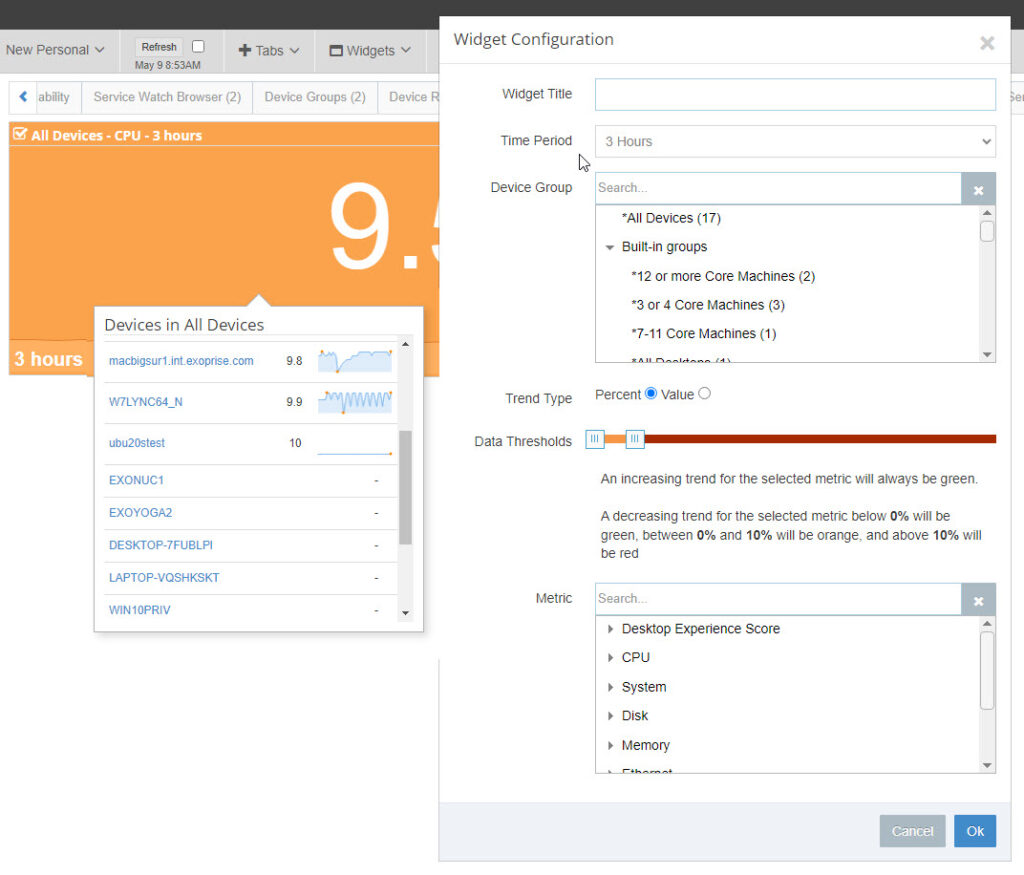
Improved Scorecards for Service Watch
Service Watch Desktop scorecards got an upgrade with better Device Group filtering and selection, improved metric selection, as well ad better drilldown to examine the top 20 devices for the affected metric.
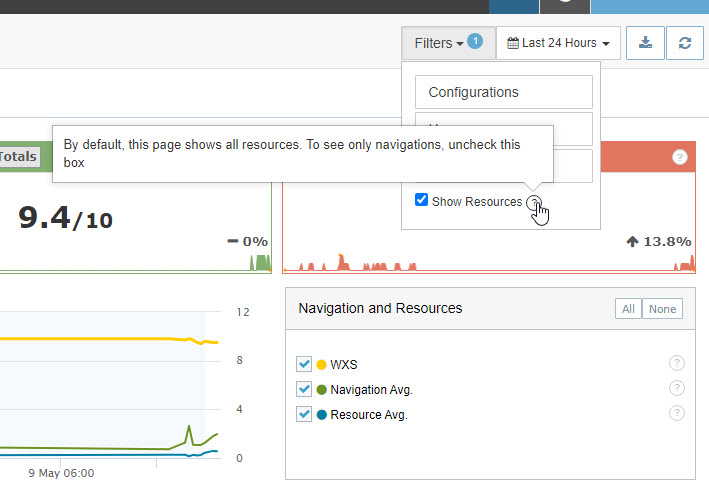
Hide or Show Resources for Service Watch Browser
The Service Watch Browser analytics page can now be filtered to only show navigation vs showing both resource queries and navigation performance. When investigating the performance of SaaS apps that may be single page apps like Gmail, Outlook for Web, or Salesforce Lightning apps, you may want to focus on resource performance, navigation performance or both.
Exoprise Synthetic Monitoring for Teams V2
Exoprise CloudReady synthetics now fully supports testing and monitoring Teams V2, audio, video, messaging and more. Proactively monitor Microsoft Teams V2 without waiting for the call quality dashboard or for someone to be affected by bad networking.
Recently, Microsoft migrated most customers to the latest version of the Microsoft Teams client and doing so has disrupted performance, capacity, and uptime for many customers. Test and monitor your Teams V2 networking migrating.
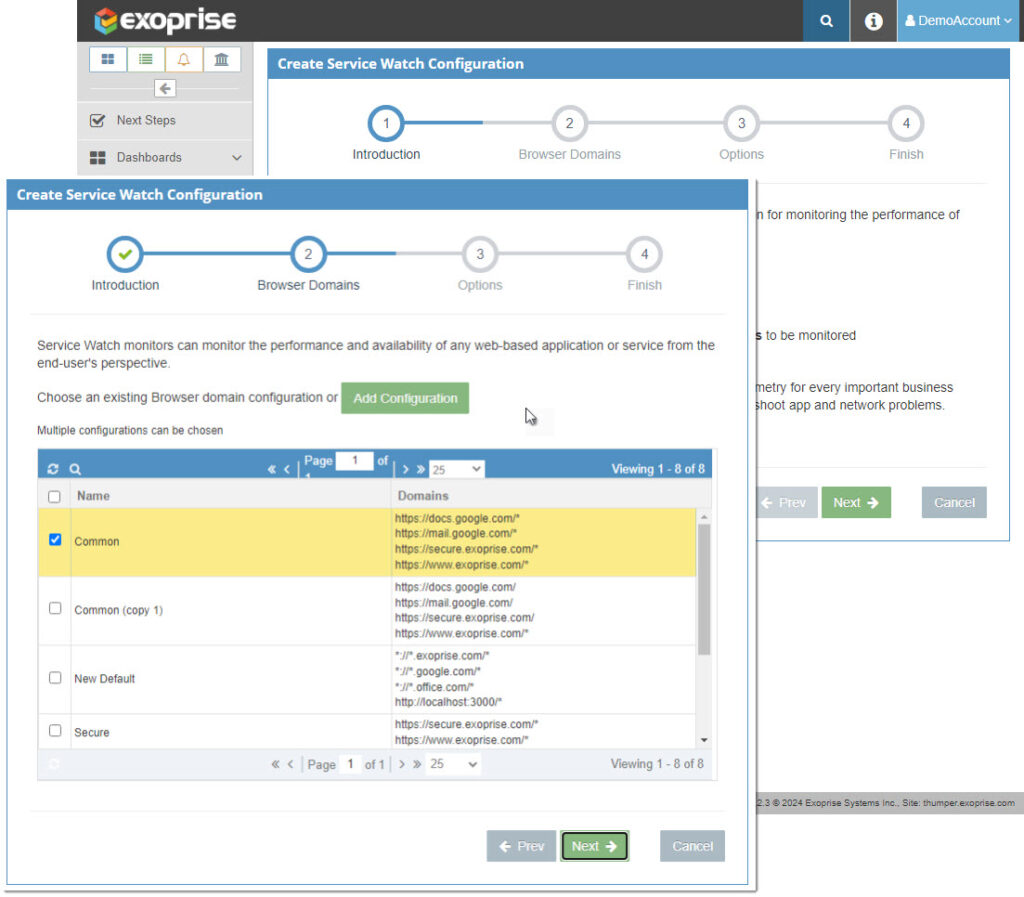
Simplified and Improved SWD Configuration
The Service Watch Desktop creation wizard was improved and now enables the creation of Service Watch Browser filters at the same time as Desktop configurations.
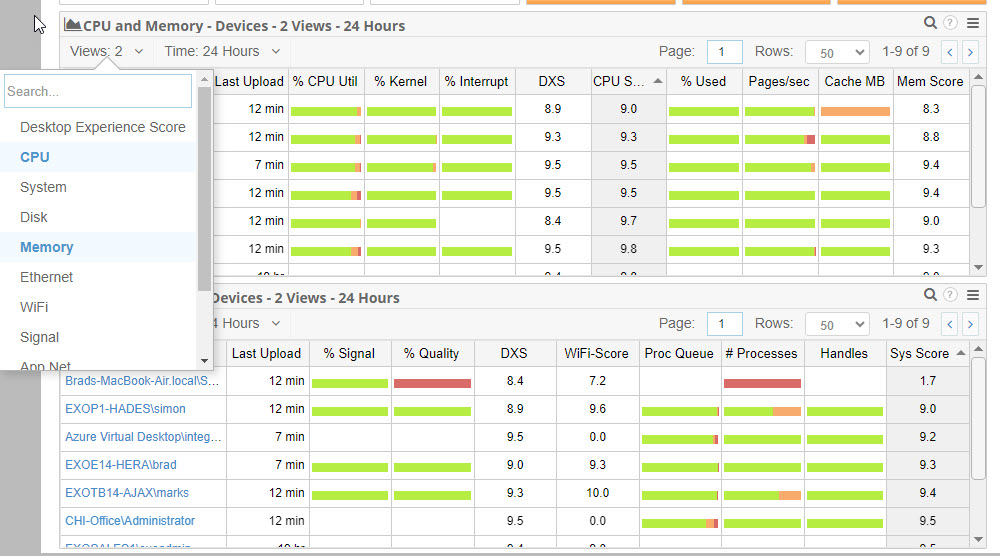
Updated Main Grid for Service Watch Desktop
We updated the Service Watch Desktop grids to support multiple views and multiple columns for more compact display and sorting.
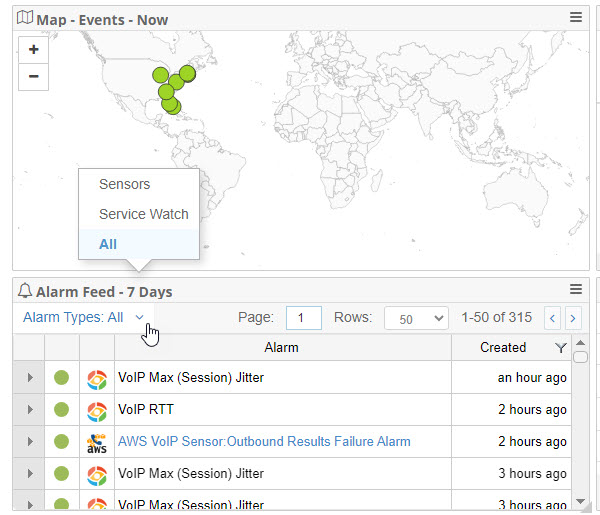
Updated Alarm Feed
We’ve improved the pagination, selection, filter and display for the alarm feed widget. Now the alarm feed widget includes support for Service Watch Desktop alarms as well as alarms from the CloudReady synthetics.
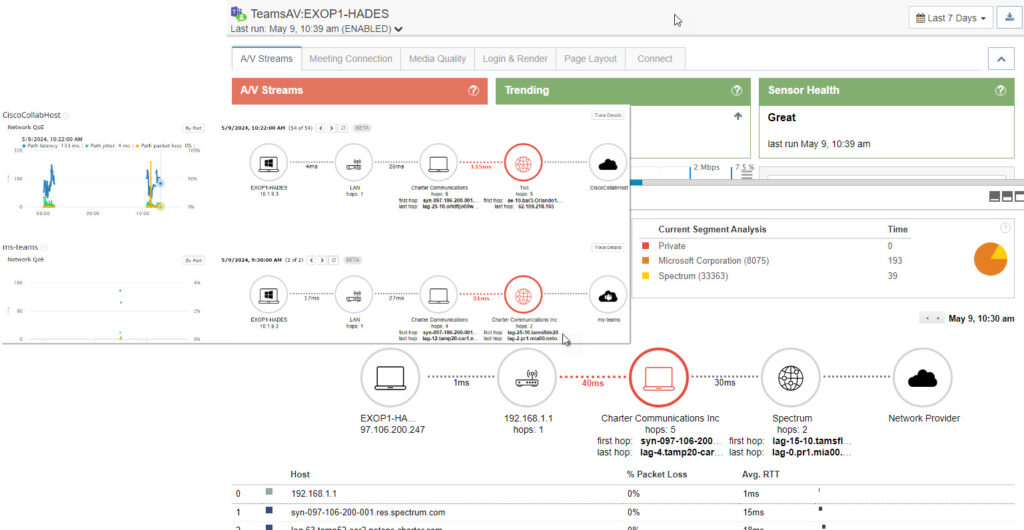
Network Path Segment Analysis
We greatly improved the network segment analysis for both Service Watch and CloudReady Synthetics.
Bug Fixes
We bury the bug fixes and minor improvements here at the end, they happen to the best of us:
- Fixed a bug with Service Watch Desktop and India-based 1/2 hour timezones which affected ISP placement
- Fixed printing the newer dashboards, some timeouts
- Fixed for AAD Graph Sensor detecting some error conditions
- We fixed a bug where some Service Watch widgets were blank depending on deployment state when the dashboards were created
- We improved detection of device ownership for Service Watch Desktop