
Exoprise released new features between September (2022) and the end of the year. We may periodically update this page as we add a few end-of-year items.
Updated Scorecards, Improved Sizing, More Compact Display
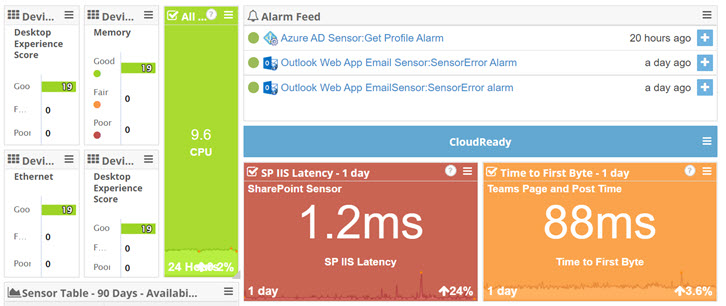
The dashboard scorecards were improved to support denser display, better sizing, and improved titles. This upgrade also improved loading speed and animation during, all to provide better information faster.
New Service Watch Desktop Data Grid
An updated Service Watch Desktop grid supports improved Device Group filtering by type in addition to icon display, filtering, sorting and identification of Device Groups.
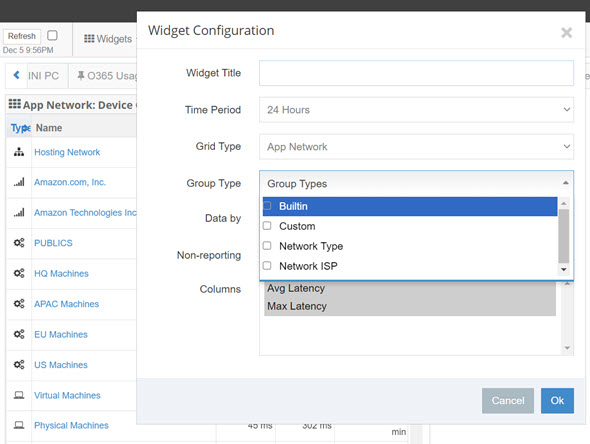
The new grid widget supports pivoting on various types of Service Watch data:
- Data by Device including overall desktop experiences, sub-resource experiences, overall UDP performance (latency, jitter, and packet loss), and TCPIP performance (latency)
- Data by Application including application performance, resource utilization, UDP performance, TCPIP performance
- Data by Device Group, which are arbitrary aggregates of devices and their aggregates.
All the various intersections of data support filtering by Device Groups or, in the case of Device Group aggregation, filtering by different types of Device Groups. Currently, the following Device Group filters are supported:
- Built-in Device Groups
- Network ISP Device Groups
- Network Type Device Groups
- Custom Device Groups
This data availability and filtering is ideal for building dashboards to surface information for different team views and groups of end-users.
Multi-grid Icons and Device Group Sorting
Finally, icons and a separate column for each Device Group type was added. The icons make it easier to see, sort, and compare the different groups of devices.
Service Watch Browser Upgrades
We’ve been continually improving the ability to quickly pinpoint and get to the root cause of Software-as-a-Service slow-downs with Service Watch Browser.
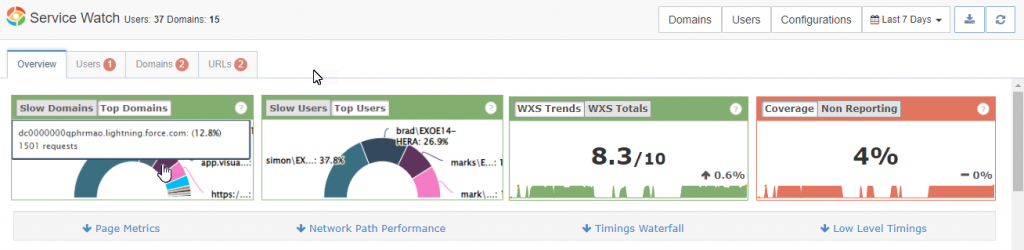
Improved Scorecards
Highlighting overall domain usage as well as potential slowdowns, coverage and overall Web Experience Score:
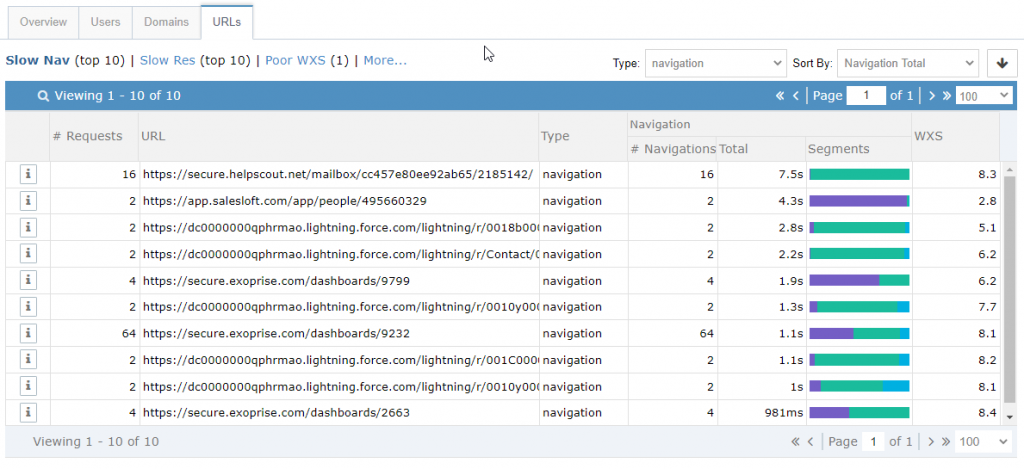
Quick Filters for Users, Domains, and Transactions
Single click filters for slow navigations, background requests, poor Web Experience Scores were added to the drilldown tabs. These enable quickly finding the source of poorly performing web and SaaS applications.
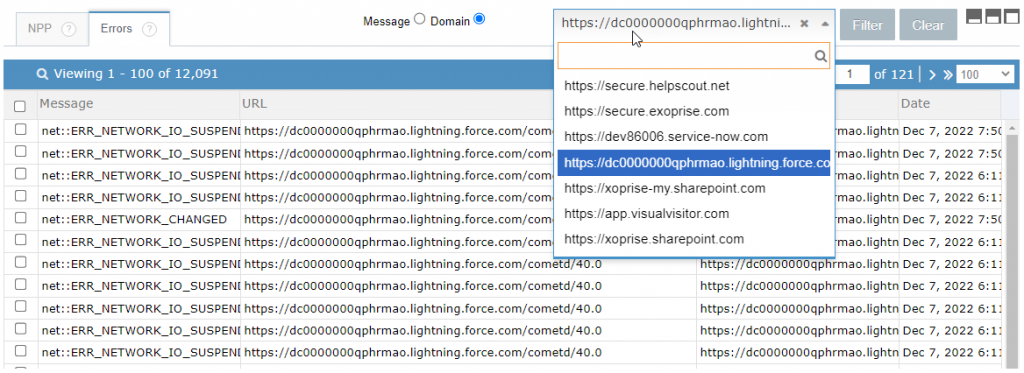
Improved SaaS Error Tab Filtering
Filtering was added to the SaaS error tab. Quickly filter by browser error type or domain to see how users were affected by different application and network errors.
Service Watch Desktop Improvements
We’ve made quite a few enhancements to Service Watch Desktop related to quickly diagnosing application network issues.
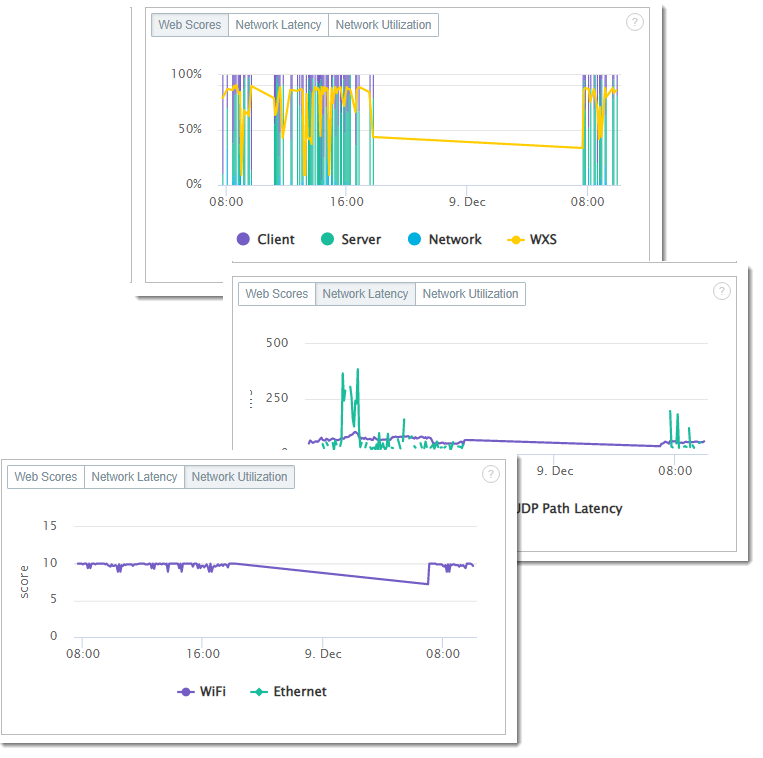
Switchable Center Panel
For a high-level overview of the web, SaaS application, 3rd party desktop latency, packet loss and jitter, we upgraded the center panel within Service Watch Desktop.
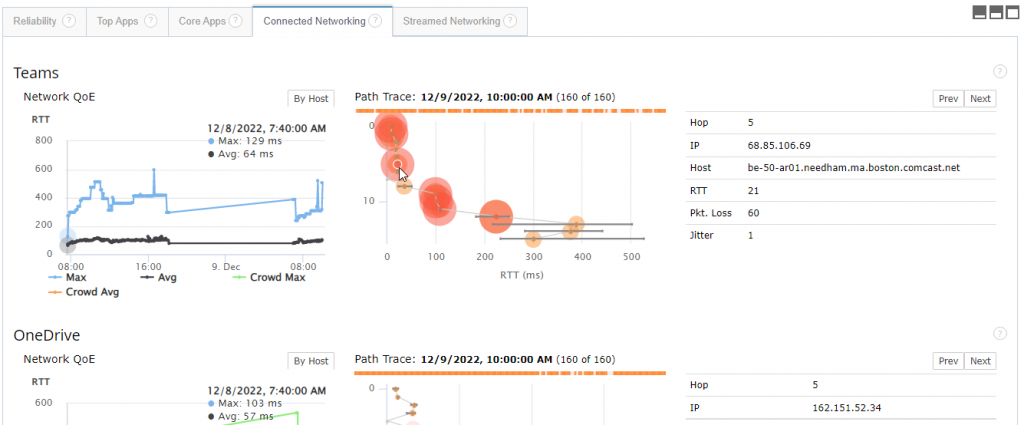
TCP/IP Network Path Performance Diagnostics
An upgrade to Service Watch Desktop includes connected network path performance data and hop-by-hop diagnostics for any third-party desktop application including all the Microsoft Office 365 apps such as Outlook, OneDrive, Teams and more. Quickly pinpoint the culprit when it comes to connecting to Teams, Exchange and other business critical services.
Shared Key Pair Installation
The wizard for creating a Service Watch Desktop setups now includes an option for configuring a shared public private key pair along with the installation. This enables deployers to move and copy credentialed CloudReady synthetic sensors between different Service Watch Desktop installations without having to reconfigure or reset the credentials.
Read more about the new shared key pair option
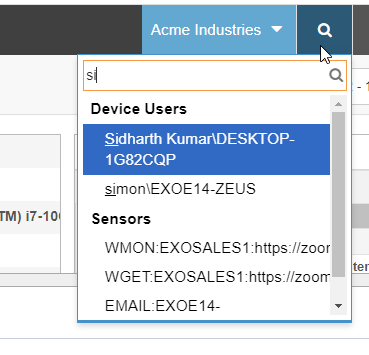
New Search For Users / Machines
You can now quickly search for a user or desktop by machine name or user logon identity. Click the search icon from the top and enter the first few characters to see a match.
Bug Fixes
We bury the bug fixes here at the end, they happen to the best of us:
- During scorecard upgrades, scorecard titles had extra text, the migration failed in certain circumstances, and loading was slow.
- Previously, when using Azure AD Single Sign-On, initial sign-on metrics were not recorded. This was fixed.
- Outlook Web Access introduced header changes that required modification to the CloudReady synthetic.
- Time period selection for the SWD canonical page was fixed.
- Basic authentication choices are no longer included for email, calendar, or other Exchange oriented sensors. This can be enabled on a customer-by-customer basis if required or if the sensors are currently configured for it.