
Exoprise released new features and upgrades for Q2 2023
Updates to the Service Watch User/Device Widget
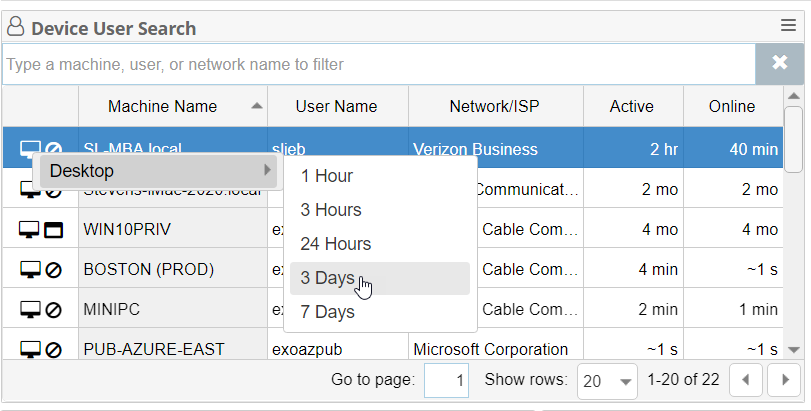
Last quarter, we released a User/Device widget that enables rapid lookup across 100’s of 1000’s of devices. We updated that widget to support navigating to different time periods. This is used by help desks to narrow the scope of conditions they’re examining with Service Watch Desktop.
Launch of Service Watch Desktop Alarms
In June, we launched Service Watch Desktop Alerts. These are real-time alerts that can be configured across 100,000’s of devices and cover unique network properties and metrics of Service Watch Desktop.
- Configure alarms for any Device Group. This enables complete flexibility to target application and network performance alarms to remote users, executives, or users that often complain of slow performance.
- Configure latency, packet loss, and jitter alarms for any core application like Microsoft Teams, Zoom, Webex or Outlook/Exchange
- Leverage dynamic ISP device groups to be alerted when ISPs are experience network slowdowns for home and hybrid users.
We will be expanding the coverage for Service Watch Desktop Alarms over the next few months and welcome feedback.
Read more information about the alarms and how to set them up.
Configure Service Watch Desktop Alarms
macOS Beta of Service Watch Desktop
A macOS version of Service Watch Desktop was frequently requested. Customers told us they wanted to capture the digital and network experience of enterprise applications, and often spent lots of time diagnosing these apps on macOS.
In May, we launched a private beta of Service Watch Desktop for macOS. Here are some highlights:
- Continuously captures system resources for any macOS device including MacBook, Mac mini, MacBook Air and more.
- Captures top resource consumers and core applications for macOS
- Captures network utilization, latency, and hop-by-hop network detail for core enterprise apps on macOS. Diagnose what’s slowing down Microsoft Teams for macOS or Outlook for macOS, even the OneDrive synchronization for macOS
Service Watch Desktop for macOS is in private beta and targeted at customers who have larger Service Watch Desktop for Windows deployments already under way. Contact us for more information and availability.
Service Watch Desktop Analysis
Many improvements have been made for analyzing, troubleshooting, and getting to the root cause of digital experience with Service Watch Desktop.
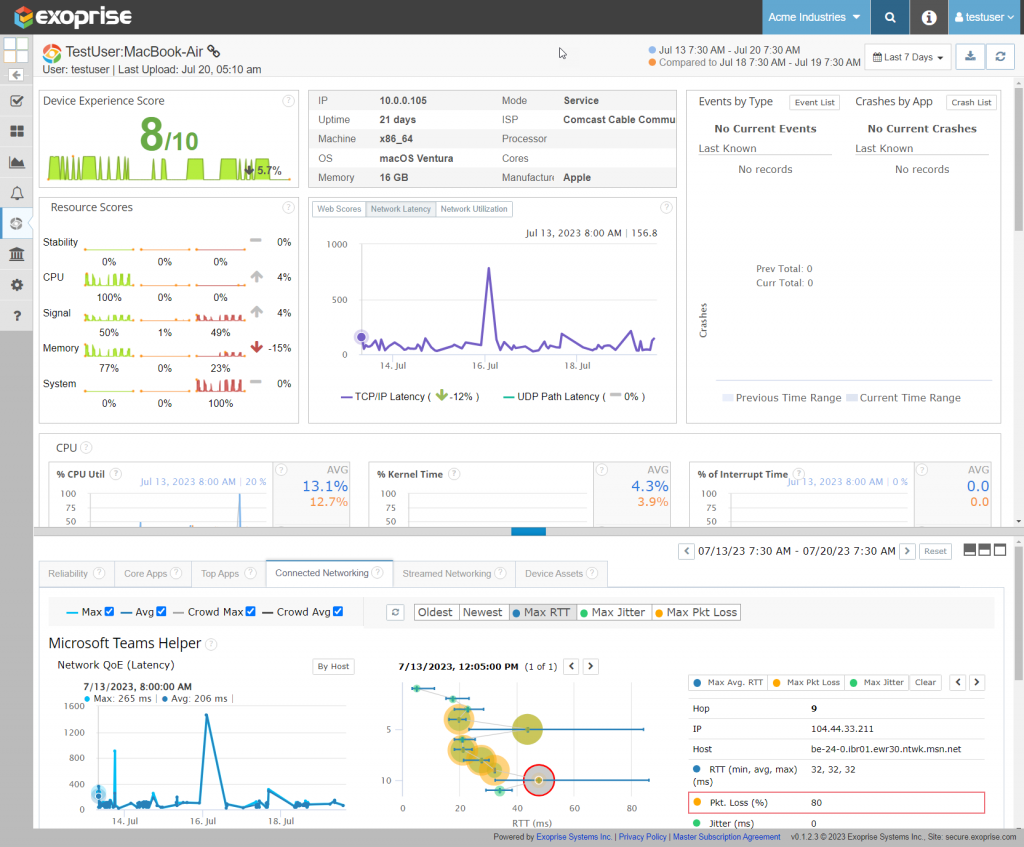
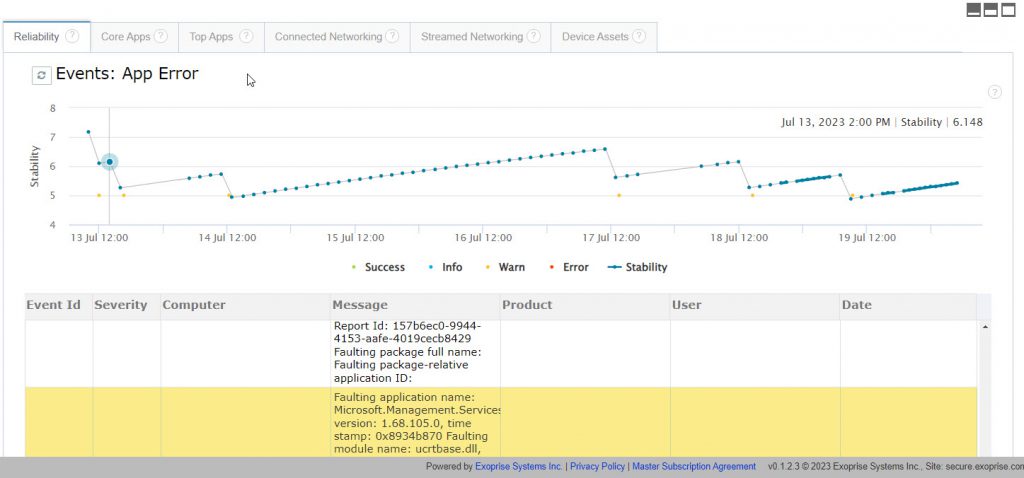
Reliability Analysis at a Glance
We have elevated the crash, update, and application reconfiguration data to the upper right for a quick view of any problems or updates to a machine. When an end-user calls up complaining of issues with an application or the OS, support personnel can quickly ascertain if there are problems with the device.
Double-click a segment or element for more detail about the event.
Resource and Network Trends
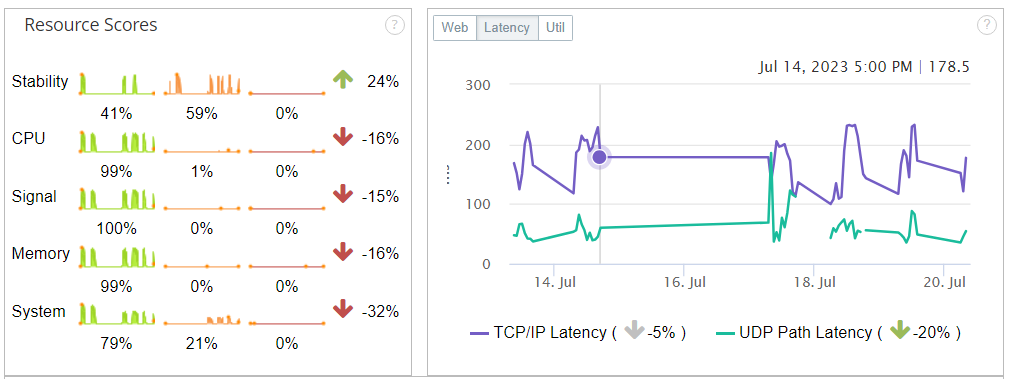
Trend percentages and indicators were added to the resource scores and network latency metrics. This enables a quick view into whether the machine is behaving differently for the selected time period. Resource scores are intended to provide a high-level view of overall system performance, and the new trend indicators assist with that goal. Network trend indicators help quantify the graphical view of TCP/IP and UDP latency, which is critical for SaaS and UC apps.
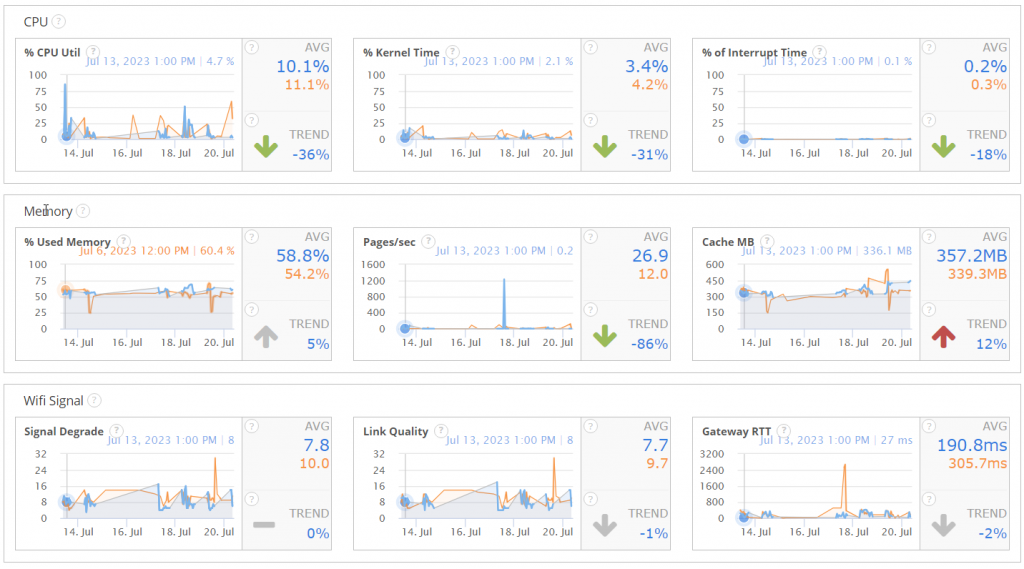
System Resource Comparisons and Trends
Moving down the page for more detail, Service Watch Desktop now displays comparison time periods and trend indicators for key, critical system resources. Operators quickly see whether system resources such as CPU, Memory, Paging, Wi-Fi signals are worse, improving, or the root cause of an issue. Troubleshooting can take place much more quickly.
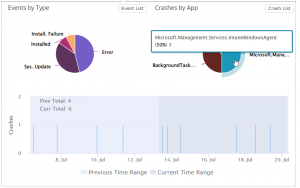
Reliability Event Filtering
Reliability events, updates, crashes are now filtered when interacting with the overall reliability data. Clear the filter to reset the view and see a full timeline of reliability events and scoring.
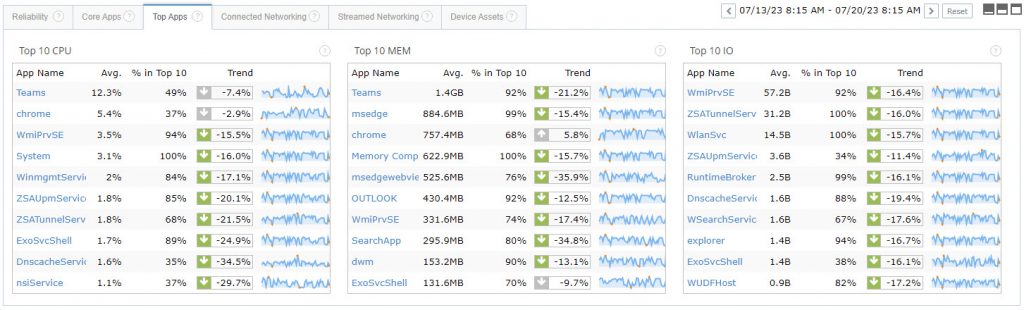
Top and Core Application Trending and History
Core applications and top consumers by resource now provide trend indicators and historical spark lines over the selected time period. Quickly detect application anomalies to identify root cause issues across your desktop estate.
Hop-by-Hop Packet Loss, Latency, and Jitter Detection for Every App
Finally, we improved the application network diagnostics for TCP/IP and UDP applications:
- Hide or show different series across all the applications
- Select different application network trace elements such as the oldest, newest, traces with the most latency, jitter, or packet loss
- For each individual application network trace, focus in on the node with the most latency (slowest response), jitter, or packet loss.
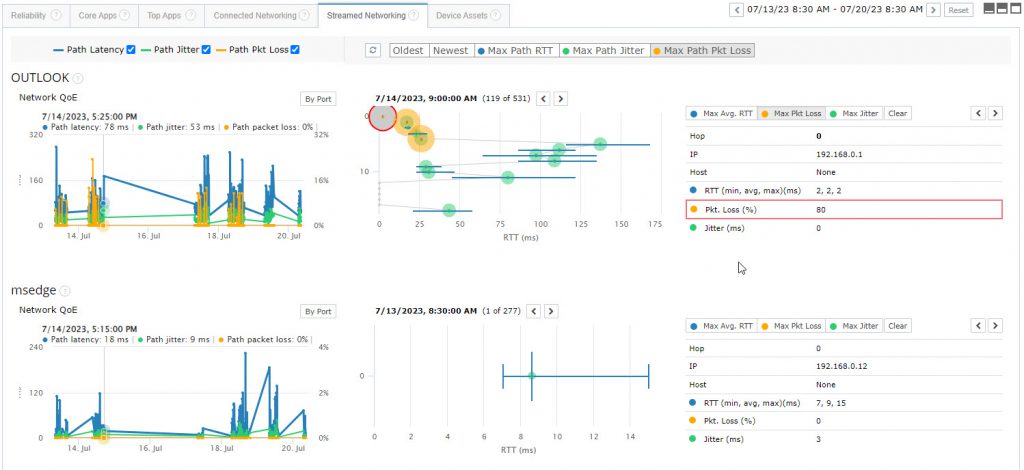
These new controls enable rapid root-cause detection when a user reports a problem.
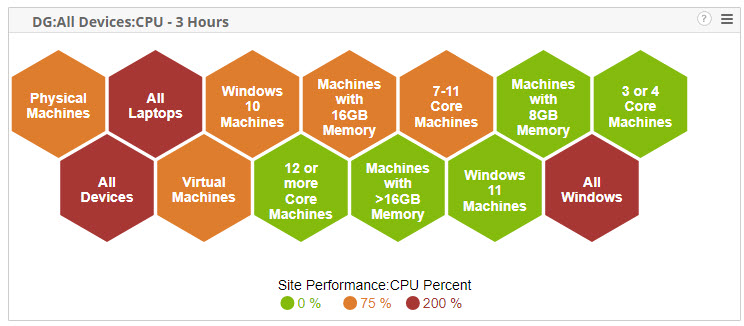
Service Watch Desktop Heatmap Widget
There is a new heatmap widget for visualizing resource utilization across device groups. Add the widget to any dashboard, configure a time period and visualize different types of device groups. Drill to investigate any issues.
Bug Fixes
We bury the bug fixes here at the end, they happen to the best of us:
- Service Watch Desktop links were added to various site management pages
- Multicast UDP transactions are now ignored
- Added short name to Device Groups
- We fixed a bug in the new Management Client that prevented it from working with proxies and Single Sign-on
- We upgraded support for the latest public previews of Microsoft Teams
- We updated support for the application formerly known as Yammer (now Viva)