
Exoprise introduced a number of new features and updates within the past few months.
Improved Synthetic and Service Watch Scorecards
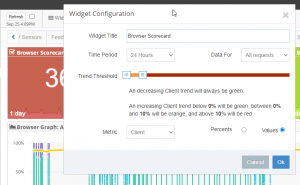
The scorecard widgets for CloudReady Synthetics and Service Watch were improved for configurable thresholds that alter the color of the scorecard. The scorecard also resizes more flexibly than before so it can be fit alongside other widgets.
New Reliability Graph for Tracking Faults, Updates, Installs and Windows Site Reliability
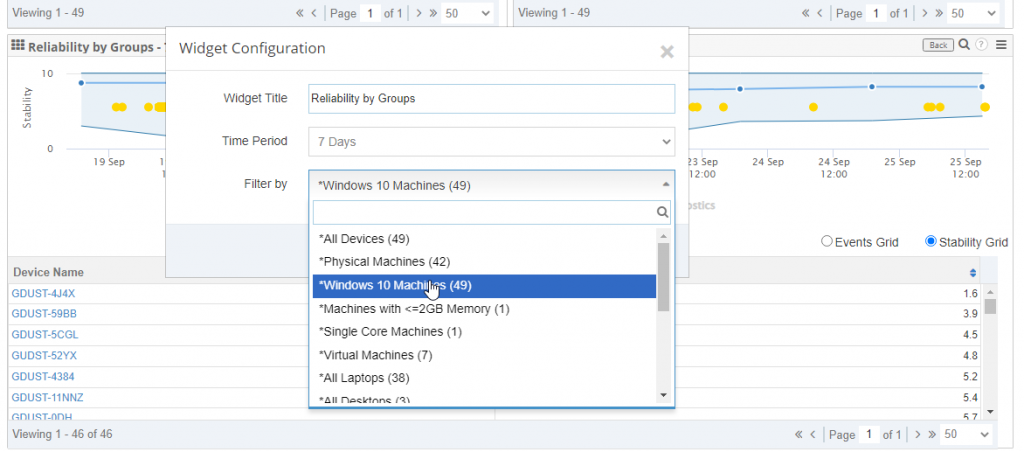
We introduced a new Service Watch Desktop widget for tracking system reliability, windows crashes, faults, application updates and more. We aggregate the Windows system reliability index and all the underlying events for each system for tracking and graphic system stability. You can filter by Device Groups (see below) and track the index over time.
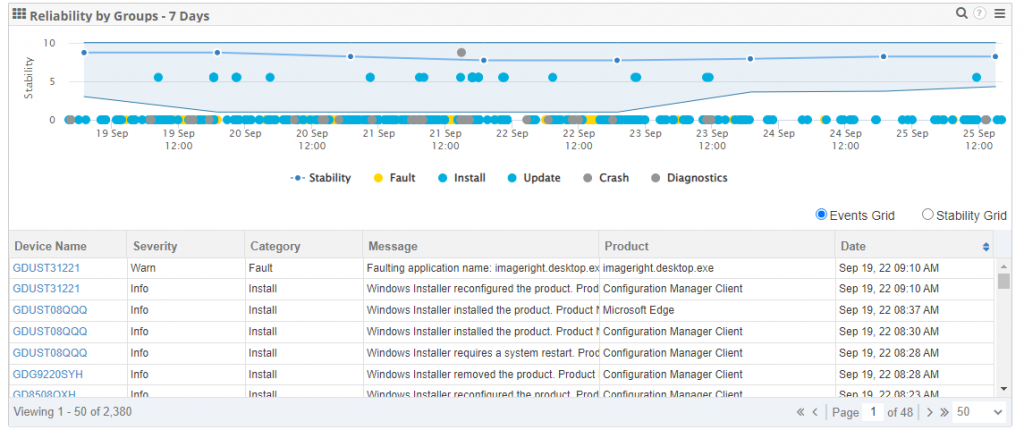
You can drill into each device to focus on why a machine is having problems. Additionally, you can sort and focus by overall system stability. For larger installations, you should filter by the various device groups to pinpoint issues.
New: UDP Path Data for Unified Communications (UC) Apps of Any Kind
Diagnose any UDP-based desktop application including Microsoft Teams, Zoom, Cisco Webex, even Remote Desktop, Citrix ICA, or Azure Virtual Desktop. Exoprise Service Watch Desktop tracks UDP or streaming conversations for any UC app and proactively identifies key network metrics such as:
- End-to-end UDP path latency
- Hop-by-hop streaming path jitter or packet variance
- UDP packet loss to media relay or peer-to-peer communications
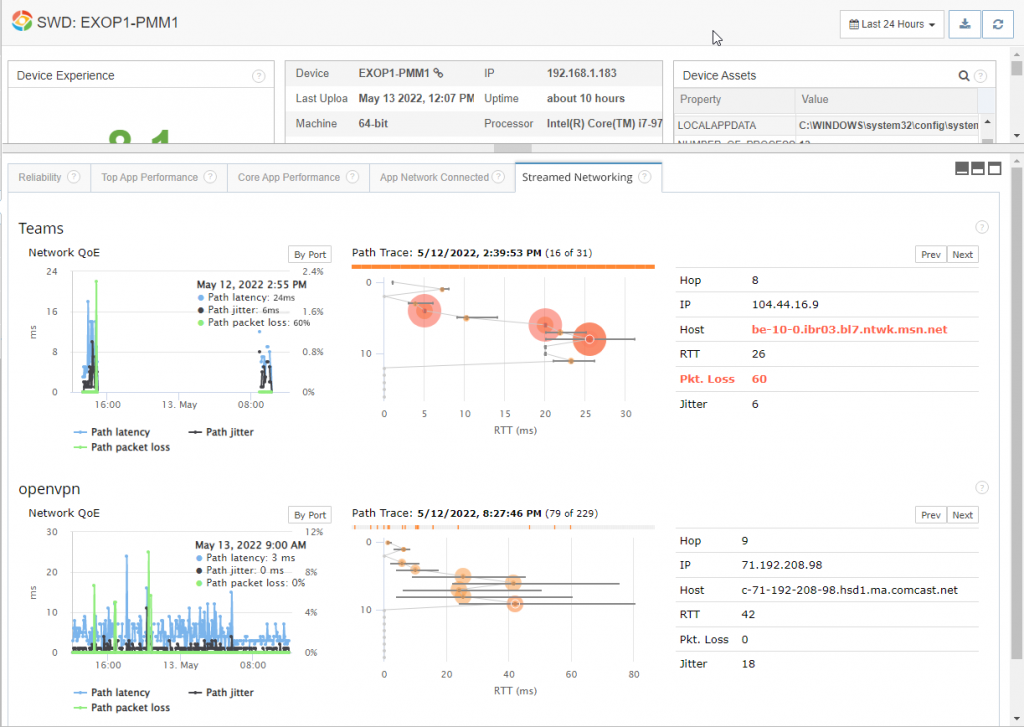
Diagnose any real-time communications app and identify poorly performing routers, gateways, ISPs, and network connections.
Synthetic Alarm Improvements
For CloudReady synthetics, various improvements were made to the alarm dashboard, sensor alarm setup, and alarm regeneration to improve alarm management.
Alarm Dashboard Improvements
- For large environments, we improved the alarm dashboard filtering by site so sites can searchable
- Sensor type and alarm recipient filtering on the alarm dashboard now has search capabilities
- Filtering by sensor element is now supported and was an often requested feature
- Filtering by aggregate alarm as well as per-sensor element was added
Alarm Setup Types
During sensor setup, at the Alarm setup step you can specify which types of alarms you want configured.
- All
By default, you can have all the alarms configured - Errors only
Select this option to only generate alarms for errors. This also includes outages. - Performance metrics
Select this option to only generate performance-based alarms
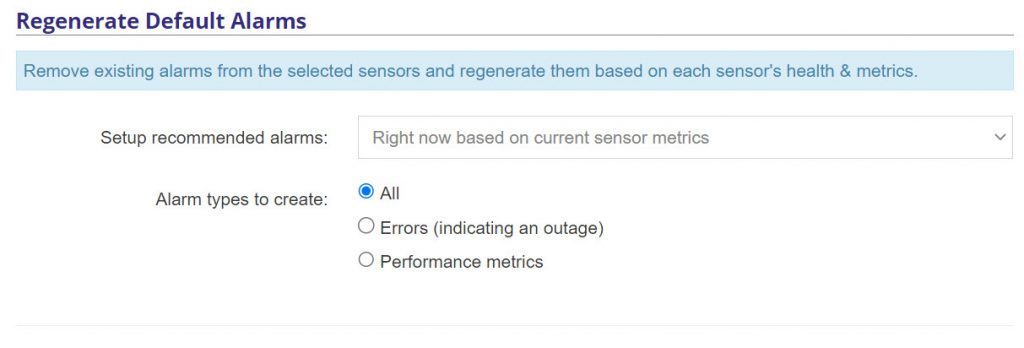
Alarm Regeneration
When regenerating alarms for sensors, you can specify what types of alarms you would like configured.
Device Groups
A powerful new feature was introduced into Service Watch Desktop called Device Groups. This allows for arbitrary grouping of device instances for aggregated and analysis.
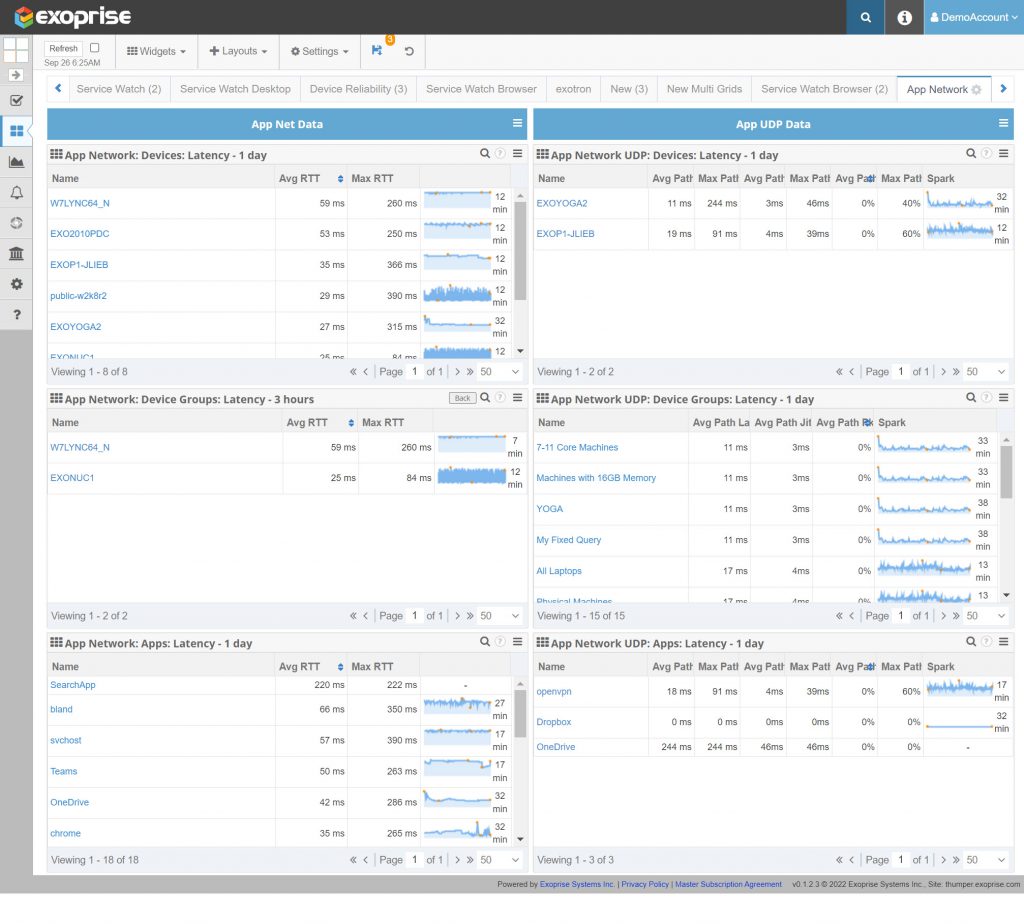
Application Network Data
Along with Device Groups, we have upgraded the core application network tab that is available when Service Watch Desktop is deployed. The application network tab is a sample of key grid widgets for diagnosing any application network problem. Here’s what you get once you start deploying Service Watch Desktop:
- TCP/IP latency as measured by the OS for core applications by Device and aggregated by custom Device Groups.
- UDP path latency, jitter, and packet-loss probed in real-time for each core application. This data can be pivoted by device or custom Device Group.
- TCP/IP latency by core application. You can quickly see the slowest applications by region or group and drill to see what user and machine is affected by network slow-downs in real-time.
- UDP path latency, jitter, and packet-loss by application with the ability to drill into which applications are performing slowly for your users and which parts of the network.
Bug Fixes
We bury the bug fixes here at the end, they happen to the best of us:
- We accounted for a Microsoft Teams bug where our sensor was being kicked out of the team that it joined. This was happening for a few of the deployed sensors and was difficult to reproduce. We employed a retry but still don’t know the underlying cause.
- A fix was deployed early in the summer for data not being available for certain Service Watch Desktop deployments.
- During scorecard upgrades, some scorecards were blank and this was fixed