New Personal and Shared Dashboards
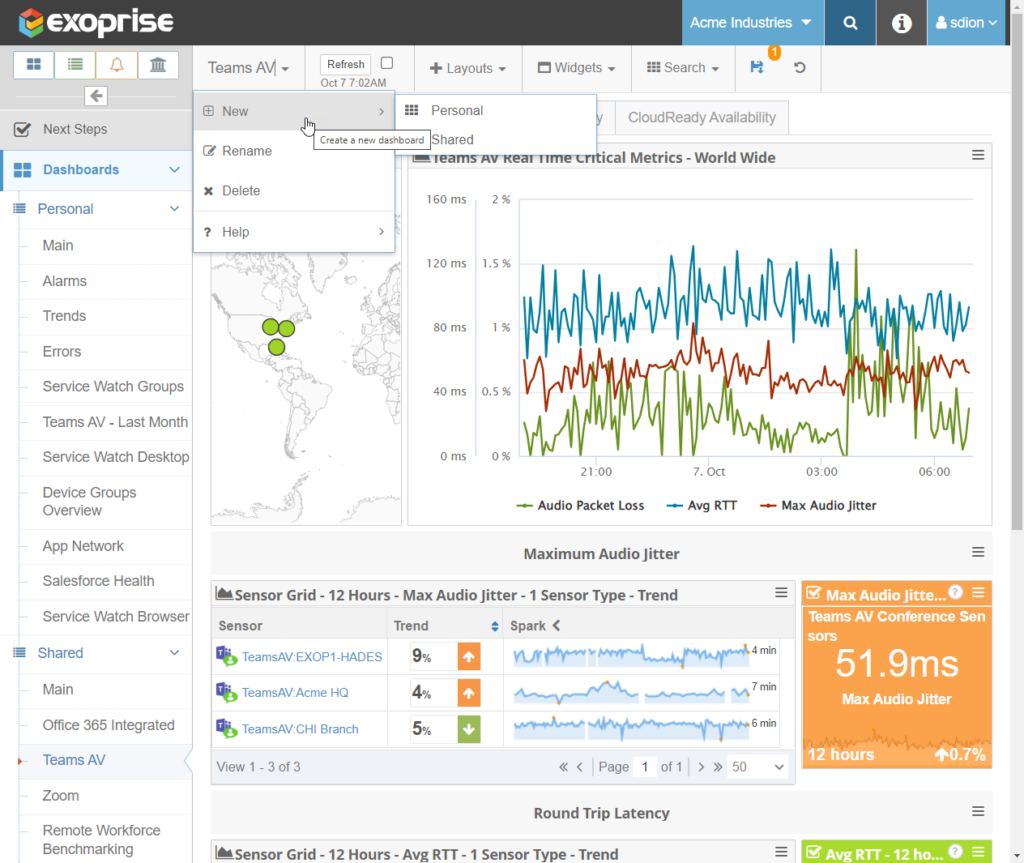
We recently introduced the capability to create multiple new dashboards with different tabs in each dashboard. This can be done within the personal dashboards as well as shared. This feature was frequently requested to build different CIO, Helpdesk, Network, and Application oriented dashboards for the different roles within IT that use Exoprise.
Create New Dashboards
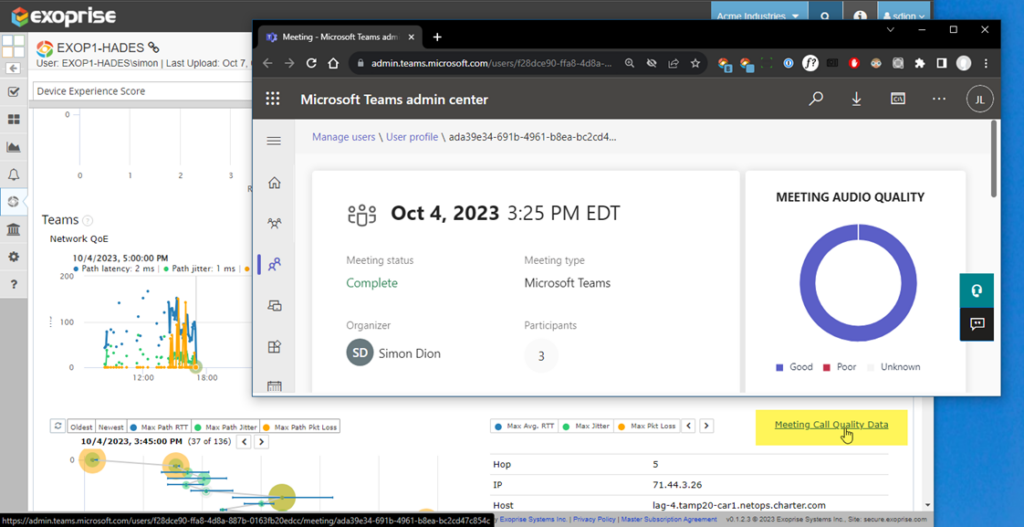
Teams Call Quality Data Integration with Real-Time Network Data
Service Watch Desktop had already provided real-time network telemetry into Teams meetings with hop-by-hop inspection. The latest update now links to the Microsoft Teams call quality information for any meeting when it detects a call or conference. To see the data, you need to have the right role within Microsoft 365 to view Teams Call Quality Data.
While the Call Quality Dashboard data is often delayed, you can compare the network telemetry from Service Watch Desktop with Teams call quality information once the data is available.
Heatmap Widget Updates
The new heatmap widget was updated for better drill down including spark lines and improved interaction capabilities. From any dashboard, you can quickly see what users are having problems with their Zoom, Teams, or Cisco Webex meetings and drill to determine the root cause.
Real-time Call Quality Integration
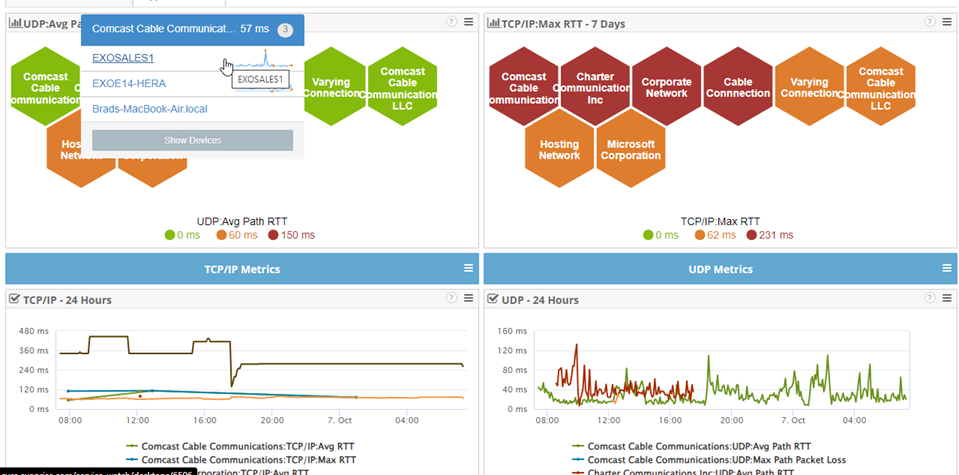
Updated Heatmap
Alarm Feed Controls and Updates
The alarm feed was updated to enable site filtering and optional Service Watch Desktop alarms within the feed. Customers wanted the ability to build site-by-site dashboards that focused on different regions, branch offices, and locations. Filtering alarms and notifications by site makes this easier.
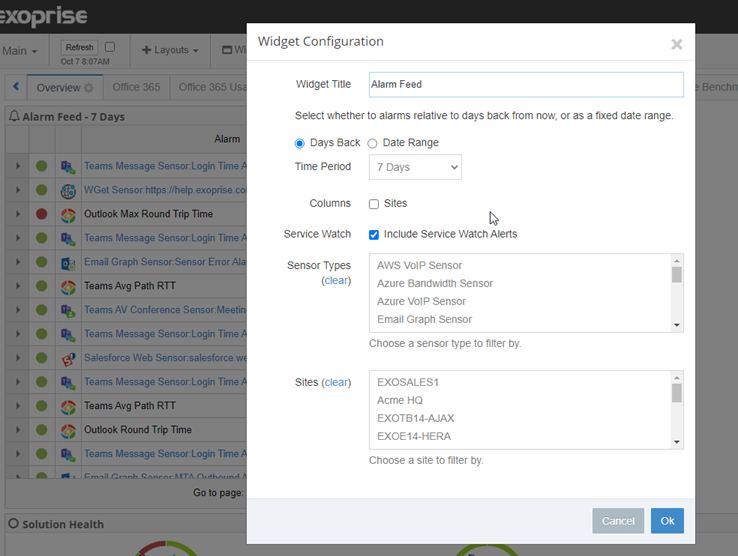
Alarm Filtering and Controls
New ServiceNow Incident Integration
Based on customer demand, we introduced improved ServiceNow alarm integration. Now, ServiceNow incidents can be easily opened and closed.
Read more about our ServiceNow integration
Article On Deploying Service Watch Desktop with Microsoft Intune
We recently published a new help article on using Microsoft Intune to package and deploy Service Watch Desktop and Service Watch Browser.
Read more about using Microsoft Intune to Deploy Service Watch
Improved Platform Notifications
Finally, we introduced improved platform notifications. You’re probably reading this article via our improved notifications. Customers were missing out on knowing about improvements, possible outages or sensor OAuth deauthorizations so we wanted to improve this feature.
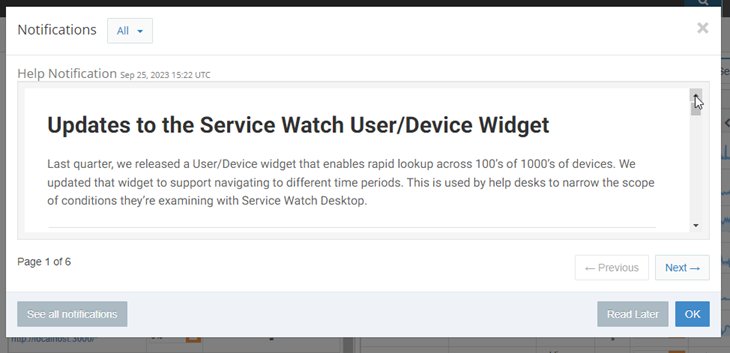
Product Notifications Update
Bug Fixes
We bury the bug fixes here at the end, they happen to the best of us:
- Our publish/subscribe functionality for distributing alarms was greatly improved
- Service Watch Desktop streamed and connected network analysis sizing and fitting was fixed
- We added the Azure Virtual Desktop and Windows 365 applications to the list of core apps for network monitoring
- For Service Watch Desktop network traces, we are automatically highlighting the correct offending node for quicker root cause and analysis.

